U.S. Gas Affordability
The Rise and Fall of Fuel: Where Are Americans Being Priced Out of Gas?
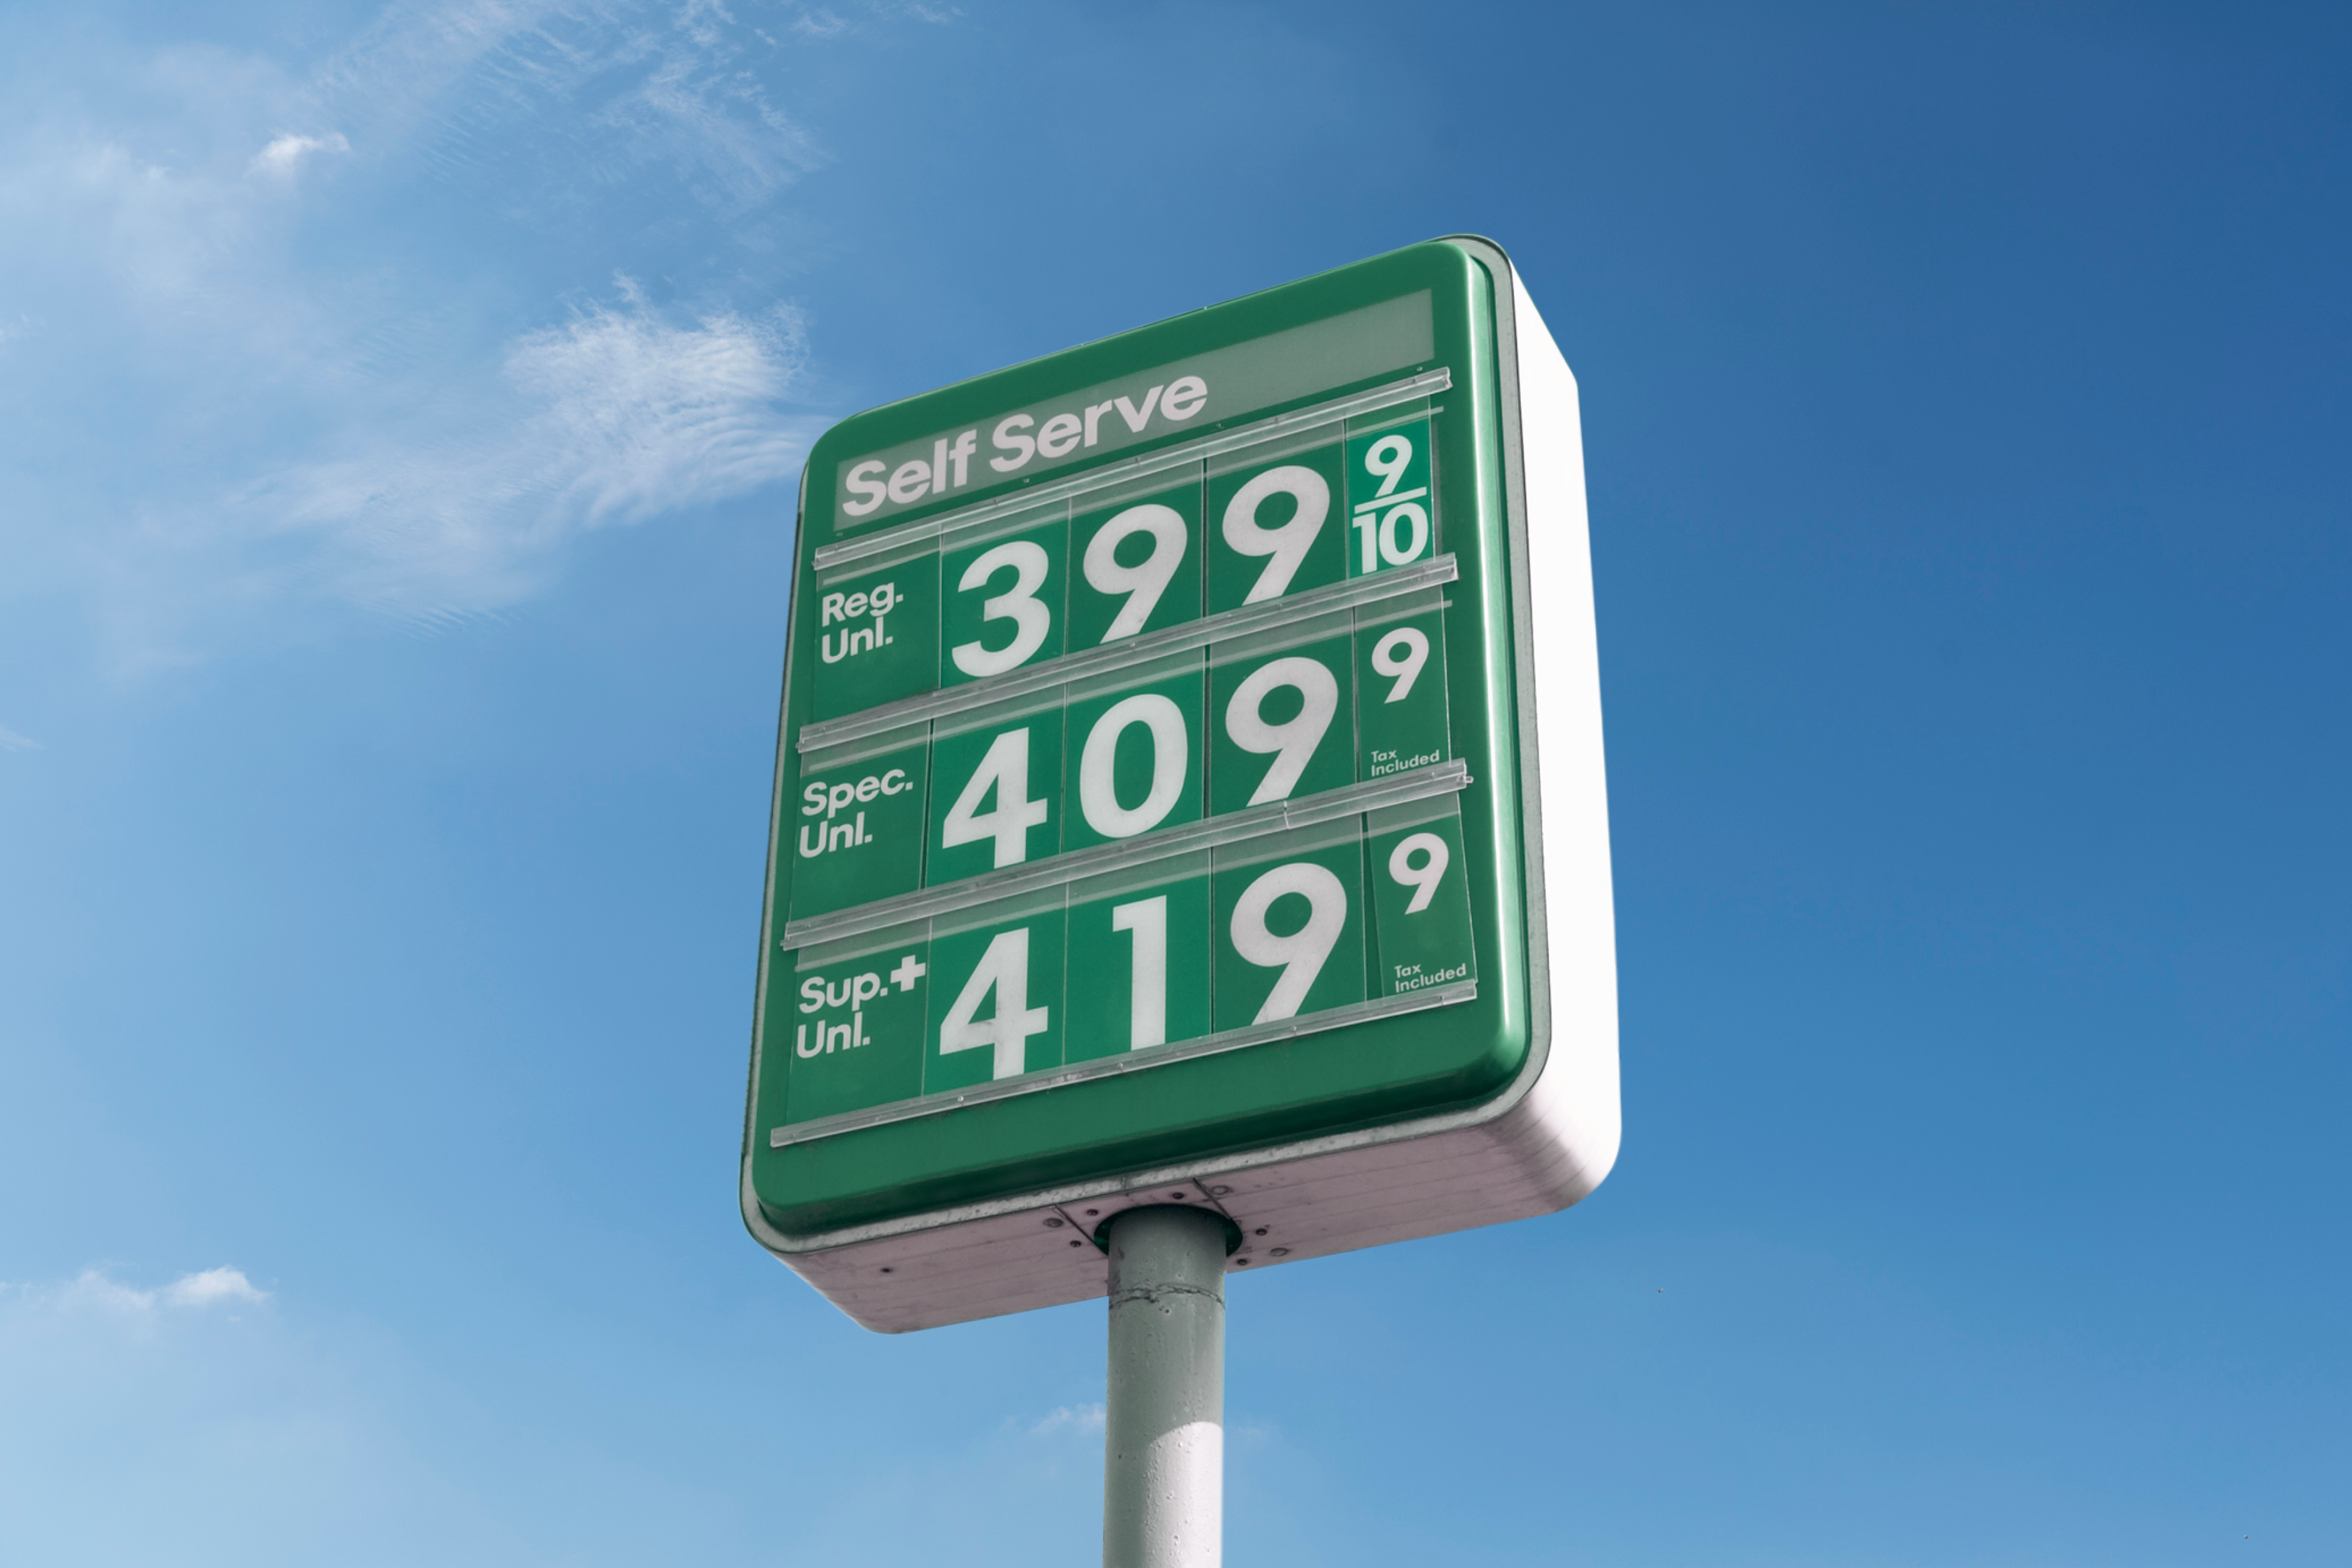
In 2022, fuel prices soared across the globe, putting more strain on people's pockets. In June 2022, gas prices in the U.S. hit an all-time high and with the added pressures of inflation and the cost of living crisis, it’s becoming more crucial to make every cent count.
While prices may have fallen since the peak in June 2022, many U.S. drivers have continued to feel the impact. A 2022 survey from the National Association of Convenience Stores (NACS) found that 60% of drivers say they’ll drive less due to the increase in gas prices.
So to discover the true extent of this problem, we investigated where exactly in the U.S. drivers are being priced out of fuel.
Our research
We’ve gathered recent localized fuel price data from GasBuddy and compared this against the Bureau of Labor Statistics’ average hourly salary data on both a state and local level. The results reveal where drivers in the U.S. are paying the most and least to fill up their vehicles, relative to their local income.
Our study also looks at the cost of filling the tank of an average vehicle in each state, mapping which locations have seen the biggest and smallest year-on-year change.
Lastly, we take a closer look at Arizona to investigate which locations have the most and least affordable gas prices, alongside a guide of other costs to consider when purchasing a car.
The states with the most and least affordable gas prices
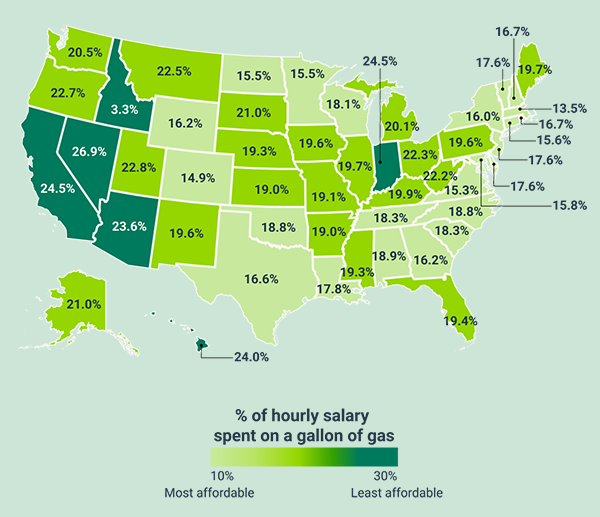
Our findings reveal Nevada takes the crown for the U.S. state experiencing the least affordable gas prices. In 2022, it cost the average driver 26.9% of their average hourly salary to cover a single gallon of gas. Drivers in Idaho are not much better off, coming in close second with a percentage point difference of just 3.3%
In Nevada, drivers can also expect to spend more annually on gas than drivers in Idaho, despite the fact that Idahoans are expected to have a higher local driving distance per year, on average.
Of the 50 states, Massachusetts was found to have the most affordable gas prices, with a gallon costing a comparatively lower 13.5% of locals’ average hourly salary. Colorado and Virginia comprise the remaining top three states with the most affordable gas prices, requiring only 14.9% and 15.3% of locals’ hourly salary respectively.
States that saw the biggest year-on-year change in gas affordability
Gas prices have been subject to unprecedented volatility in recent months. By comparing each location’s average hourly salaries vs. the price of gas in 2022 and 2021, we analyzed the changing trends year-on-year and identified which states have seen the greatest change in the cost of a gallon of gas.
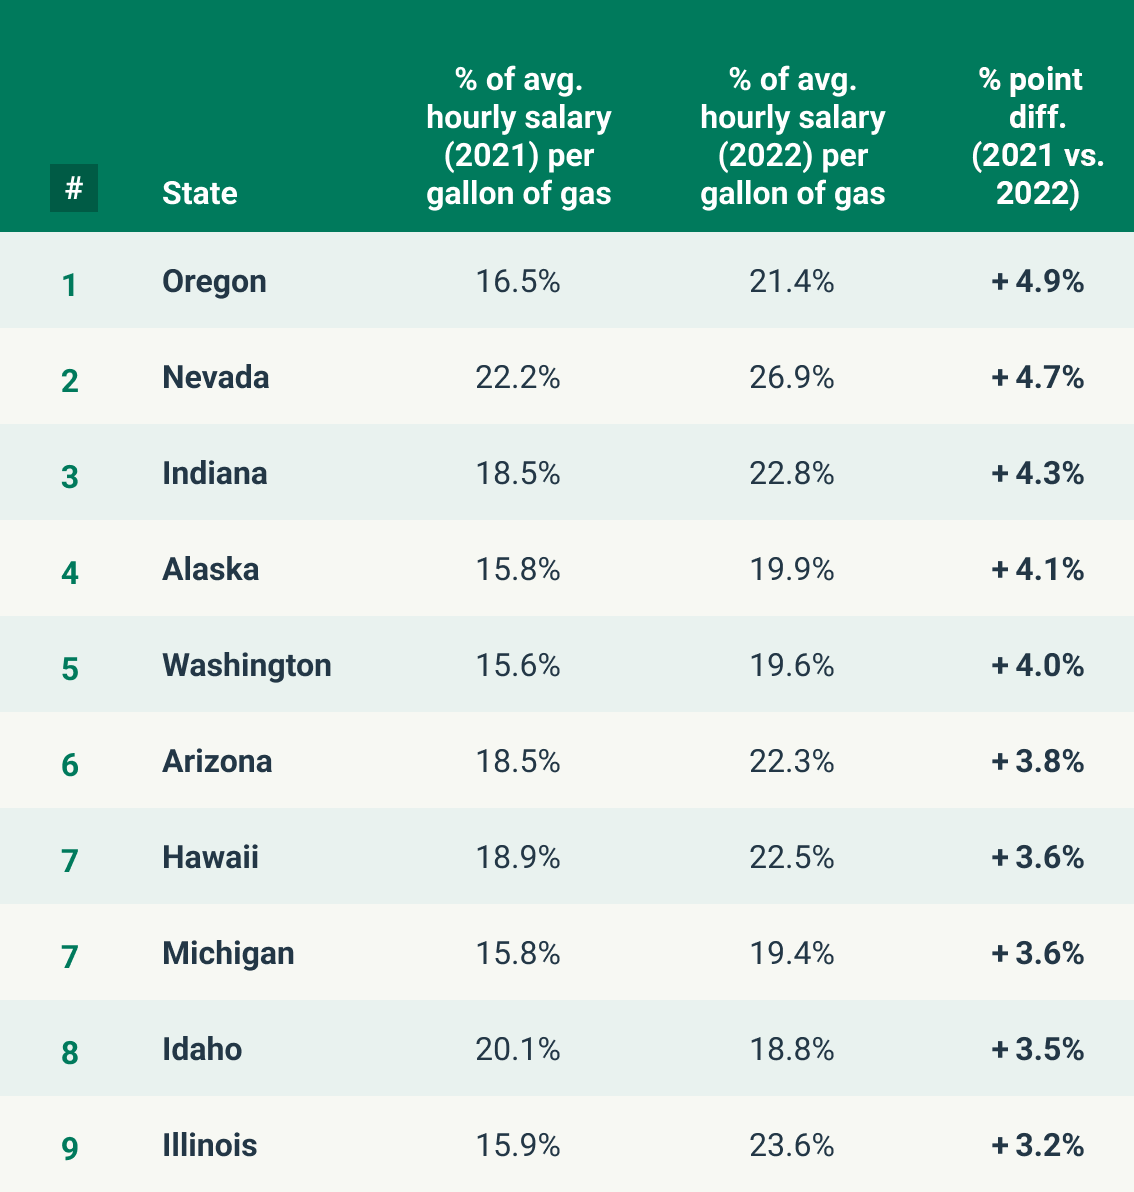
Our study revealed Oregon as the state with the largest increase in gas prices, with the average resident seeing a 4.9% uplift in the amount of salary required to cover the cost of a gallon of gas, year-on-year.
Nevadans find themselves again on the wrong end of the gas affordability spectrum, with the state ranking second and residents needing to put 4.7% more of their salary towards the price of fuel than in 2021.
The states that saw the smallest change in year-on-year gas price affordability
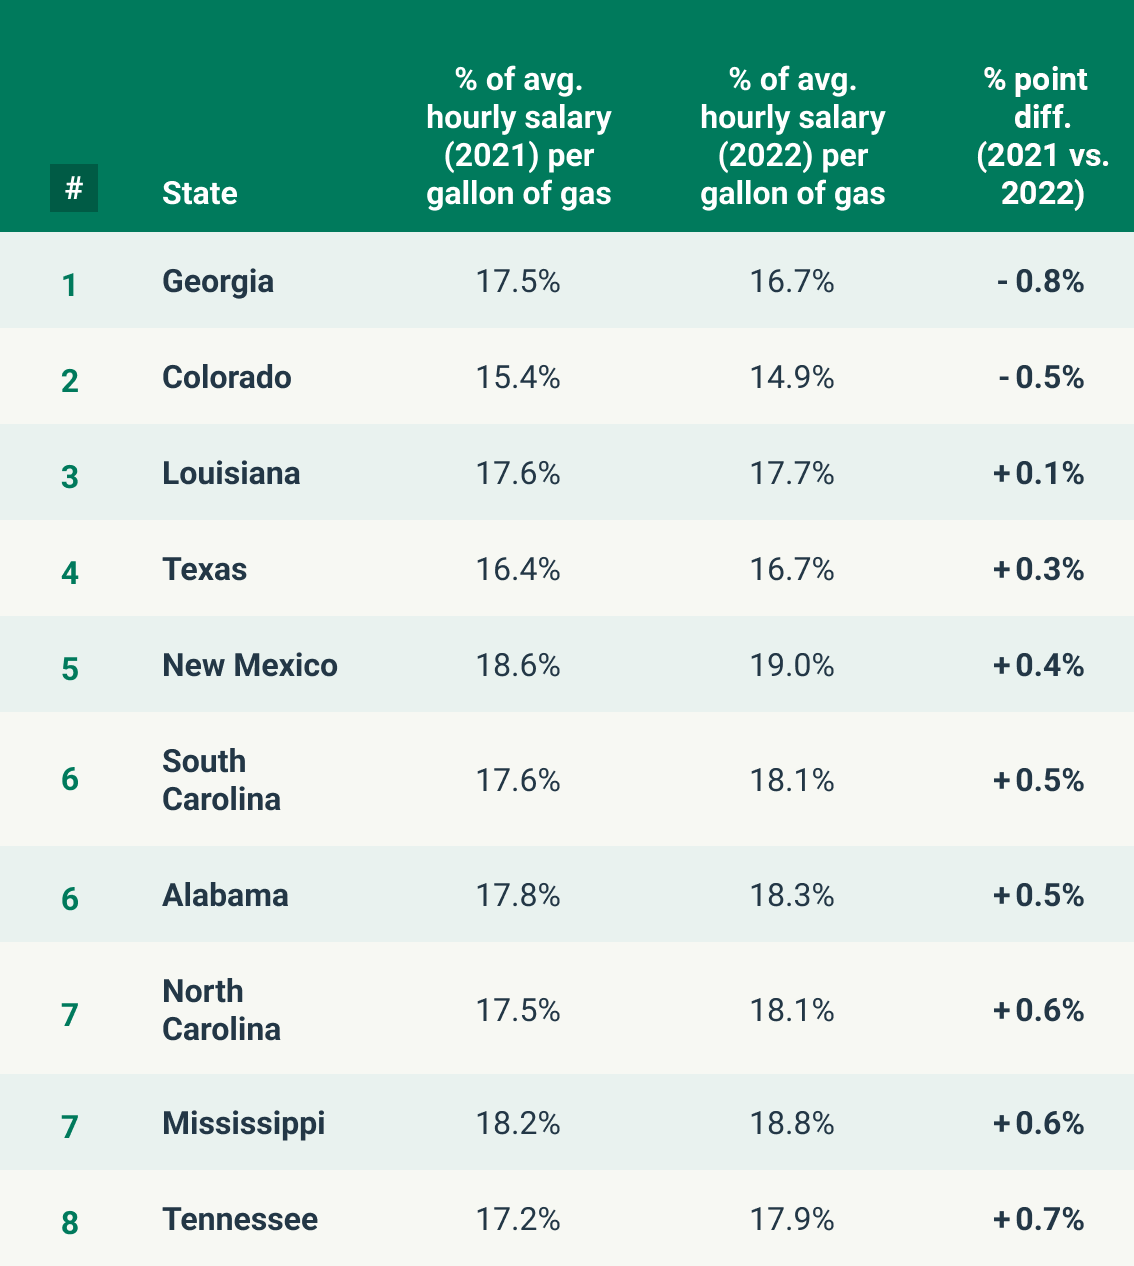
Looking at the other end of the scale, two states were lucky enough to see an improvement in the relative cost of their gas between 2021 and 2022. Colorado and Georgia’s fuel prices decreased 0.5% and 0.8% respectively in 2022, relative to average local incomes.
Which states do drivers spend the most on refueling a typical vehicle per year?
Our analysis finds that drivers in Wyoming should expect to pay the most when it comes to the cost of filling up annually (assuming a typical U.S. vehicle to have a fuel efficiency of 39.4 miles per gallon).
Based on 2022 prices, drivers from Wyoming will spend an eye-watering $2,233 on fuel each year - considerably more than residents in any other state. Indiana sits in second place with the average estimated expenditure for drivers coming in at $1,924, over $300 less.
This difference in annual cost is in part impacted by the average Wyoming driver traveling further per year than those in any other state — 24,068 miles on average.
Wyoming is a sparsely populated, largely rural, state with fewer remote jobs than elsewhere in the country, so perhaps it’s not a huge surprise that residents are more likely to travel further for work. Rob Godby, a Professor at University of Wyoming explains that “You also have to think about how people use energy and in rural states like Wyoming, where you have to drive further and it’s more likely you have a larger vehicle that consumes more gasoline, you’re going to have higher gasoline costs.”
In comparison to Wyoming’s drivers, New Yorkers and Rhode Islanders spend less on fuel per year, averaging $996 and $974 annually. They also travel fewer miles per year, with an average distance of 9,961 and 10,166 miles, respectively.
In which states has the annual cost of refueling a typical vehicle changed the most?
In order to quantify how the volatility of gas prices is affecting drivers, we sought to find out which U.S. states saw the biggest changes in annual gas expenditures.
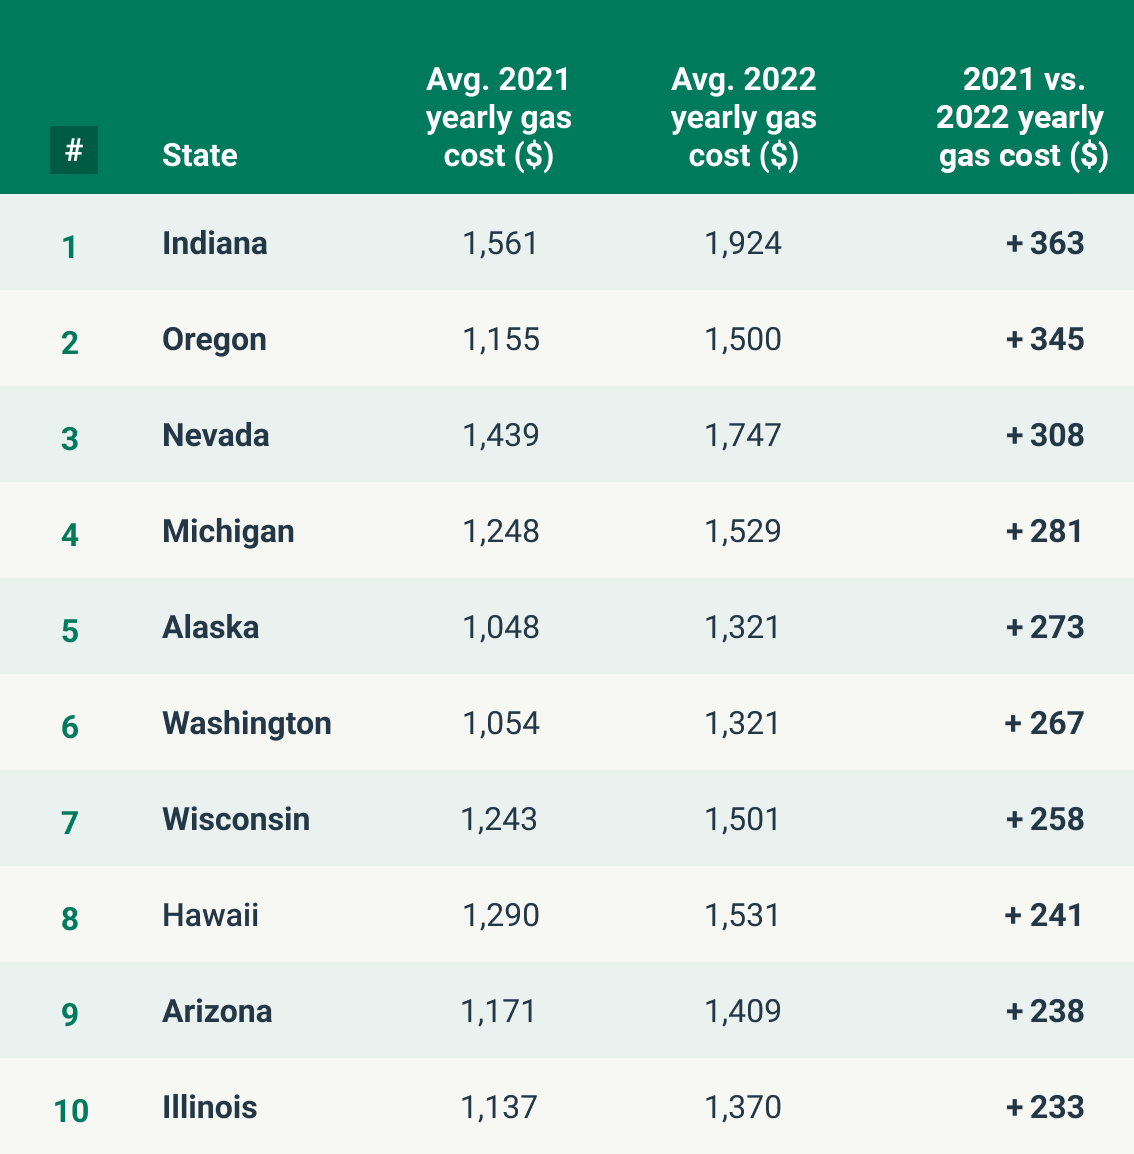
Indiana’s driving population has experienced the biggest nominal increase in the annual cost of refueling, equivalent to an extra $363 in 2022 vs. the same period in 2021. Drivers in Oregon and Nevada also aren’t far behind, each needing to spend an additional $345 and $308 respectively on fuel in 2022 than they did in 2021.
This annual cost estimate was calculated by combining the average number of miles driven in each state each year with the average consumption of a typical car.
Although Indiana’s average annual gas cost increase ranks highest overall, second placed Oregon has seen a large increase in raw gas prices over the last year, at a rate of an additional $1.11 per gallon. As a result, the average driver in Oregon has had to adapt to a considerable 29.9% year-on-year rise in their annual gas expenditure.
The U.S. metro areas where locals spend the lowest proportion of their average hourly salary on a gallon of gas
While our analysis so far has looked at the affordability of gas across states, we wanted to dig deeper and see how the fluctuating gas prices were affecting car owners on a local metropolitan level.
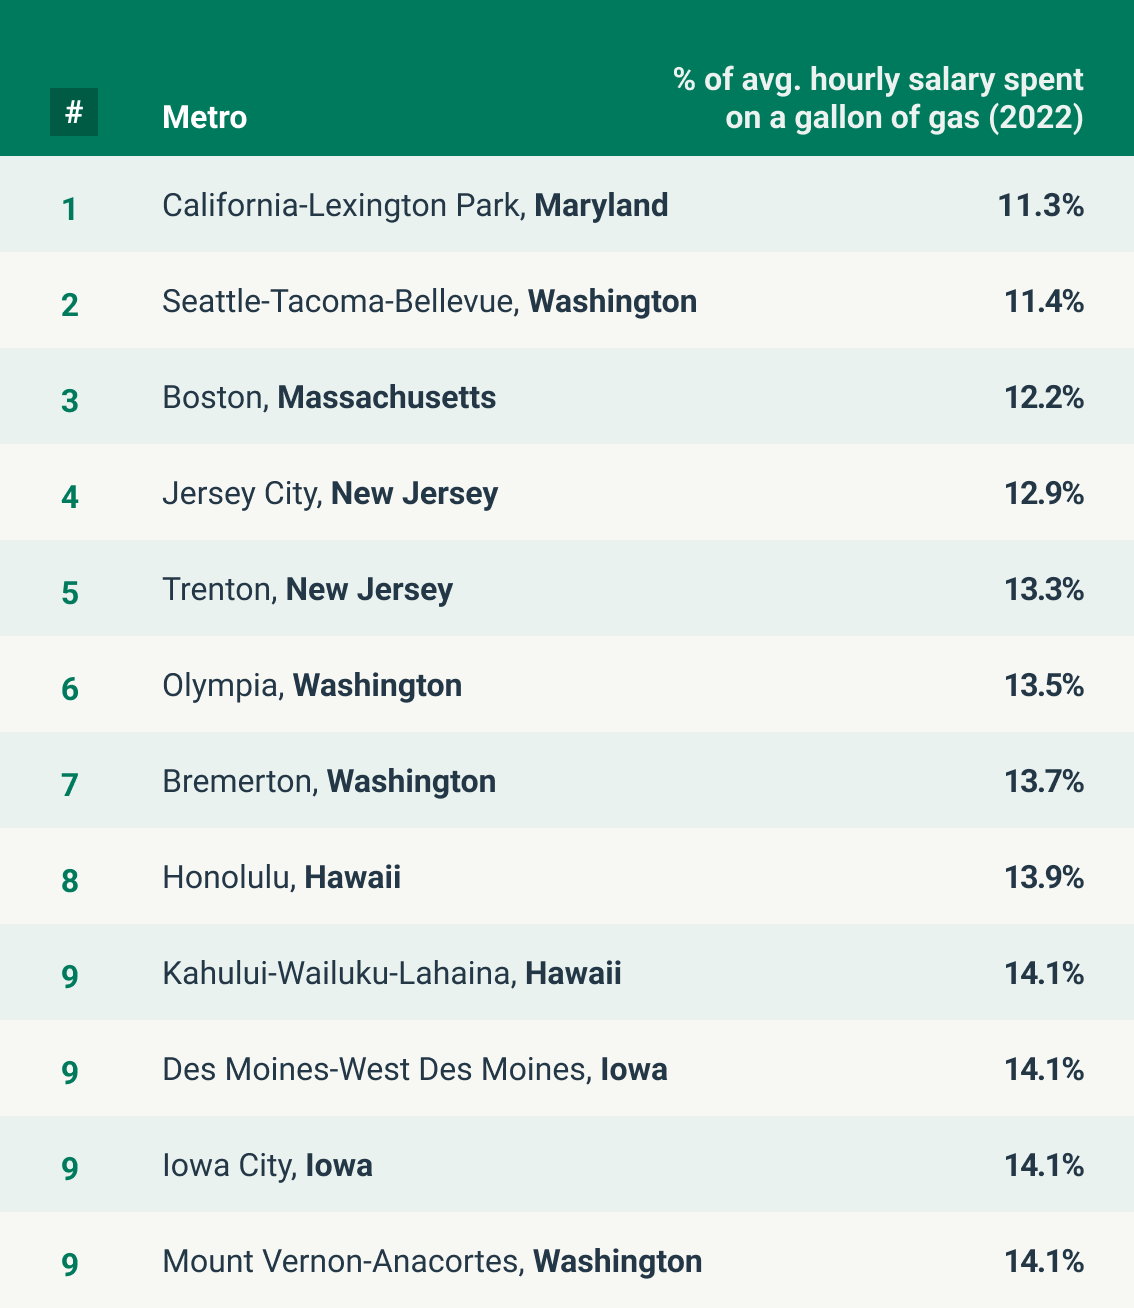
We found that the Maryland metro area of California-Lexington Park has the most affordable gas prices with the cost of a gallon of fuel coming out at 11.3% of locals’ average hourly wage.
The state of Washington has four metro areas in the top ten, including Seattle-Tacoma-Bellevue, which ranks second. This makes Washington state one of the most consistently affordable areas in the U.S. when it comes to filling up at the pump!
The U.S. metro areas where locals spend the lowest proportion of their average hourly salary on a gallon of gas
Our analysis includes the local U.S. metro areas ranked by smallest percentage of average hourly salary spent on a gallon of gas. Sources: HiRoad; GasBuddy local gas prices; BLS.gov local salary data; all data is correct as of November 7th, 2022.
The U.S. metro areas where locals spend the greatest proportion of their average hourly salary on a gallon of gas
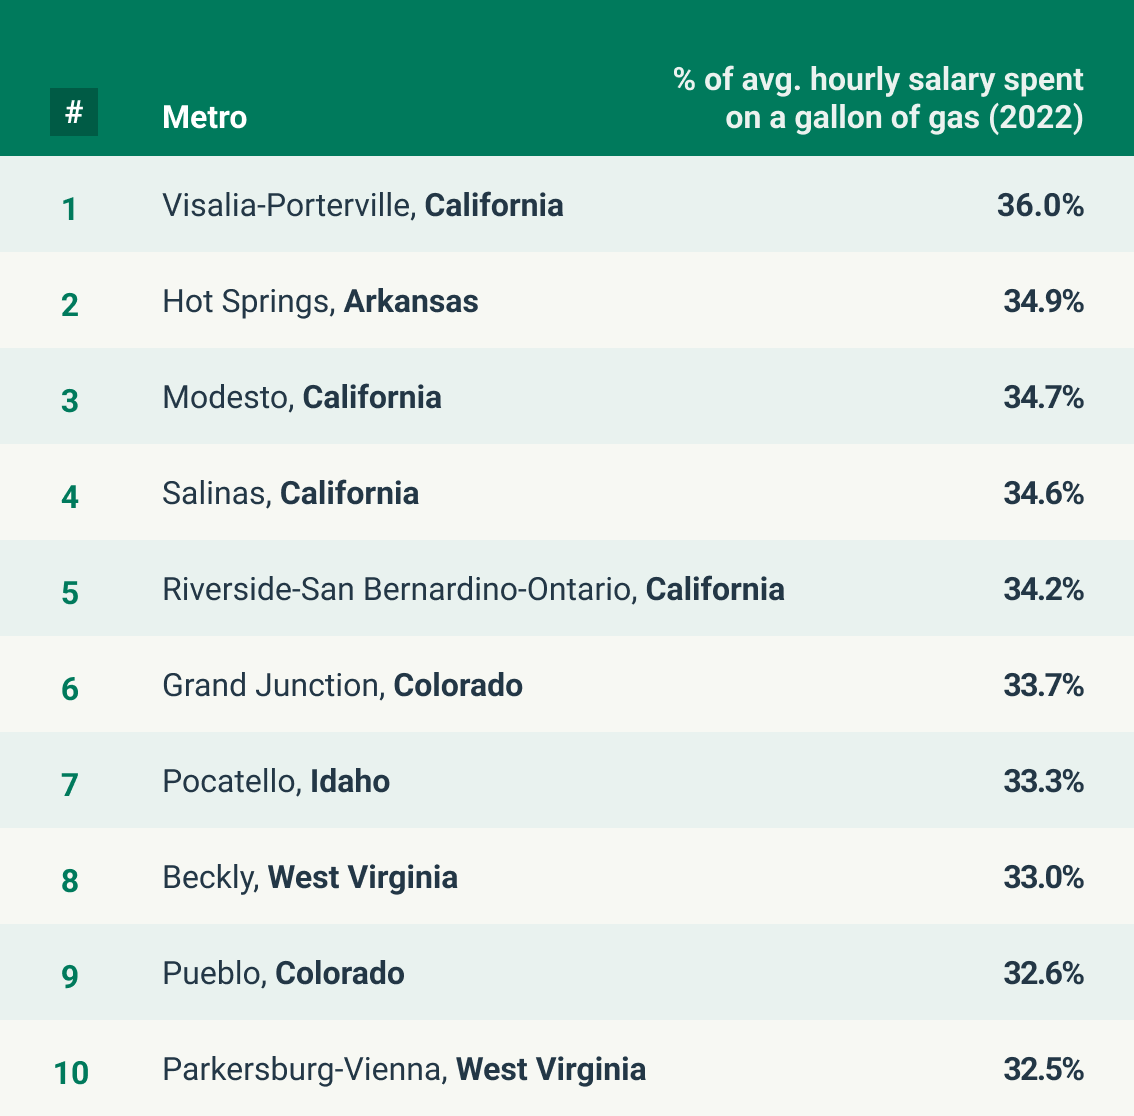
Perhaps unsurprisingly, California has the most metro areas where drivers can expect to spend the biggest chunk of their average hourly salary on a gallon of gas.
In fact, four of the top five spots are taken by Californian metro areas. Visalia-Porterville tops the list with a considerable 36% of the average hourly salary being required to cover the cost of a gallon of gas in the area.
Hot Springs, Arkansas, is the only non-Californian metro area in the top five, where drivers can expect to pay 34.6% of their hourly salary for fuel. This makes gas in the Hot Springs metro area the second least affordable in the U.S., relative to local metro salaries.
The U.S. metro areas where locals spend the greatest proportion of their average hourly salary on a gallon of gas
Our analysis includes the local U.S. metro areas ranked by highest percentage of average hourly salary spent on a gallon of gas. Sources: HiRoad; GasBuddy local gas prices; BLS.gov local salary data; all data is correct as of November 7th, 2022.
The biggest percentage change in hourly salary spent on a gallon of gas in U.S. metro areas (2021 vs. 2022)
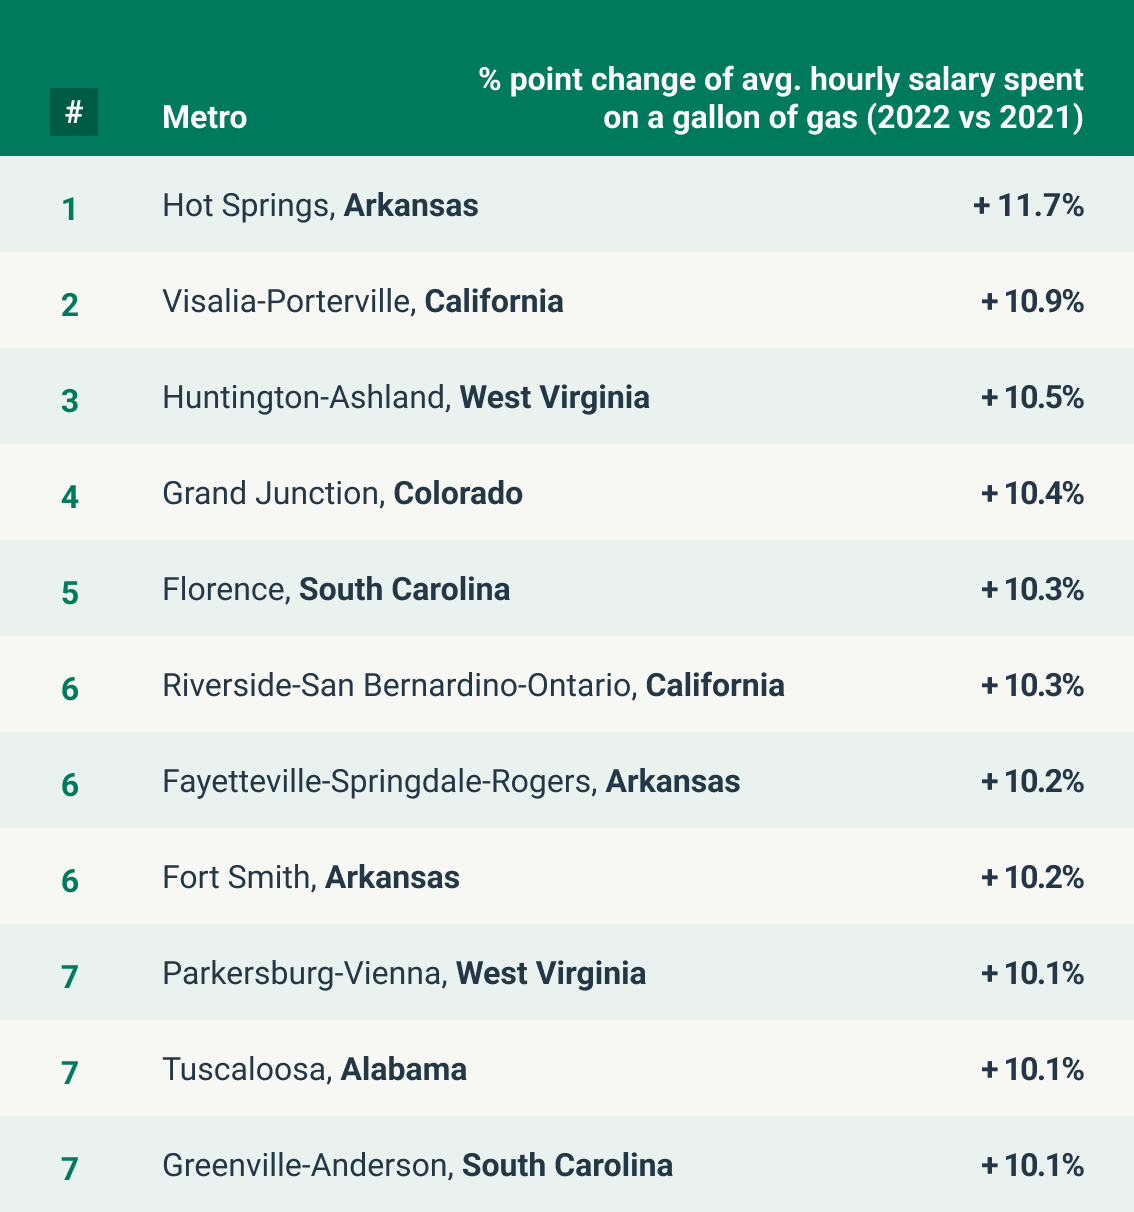
Our research has shown that out of all metro areas across the states, Hot Springs in Arkansas has seen the greatest year-on-year change in gas affordability. We’ve found local workers are now having to put a staggering 11.7% more of their average hourly salary towards the cost of a gallon of gas in the area.
Two other Arkansas metro areas appear in the top ten, alongside metros in California, South Carolina, Colorado, West Virginia, and Alabama. This illustrates that the cost issue isn’t limited to a particular part of the country.
It’s a narrow margin between first place Hot Springs and tied tenth places Tuscaloosa and Greenville-Anderson, with a mere percentage difference of just 1.6%.
The biggest percentage change in average hourly salary spent on a gallon of gas in U.S. metro areas (2021 vs. 2022)
Based on the biggest percentage point change of average hourly salary spent on a gallon of gas between 2021 and 2022. Sources: HiRoad; GasBuddy local gas prices; BLS.gov local salary data; all data is correct as of November 7th, 2022.
The smallest percentage change in average hourly salary spent on a gallon of gas in U.S. metro areas (2021 vs. 2022)
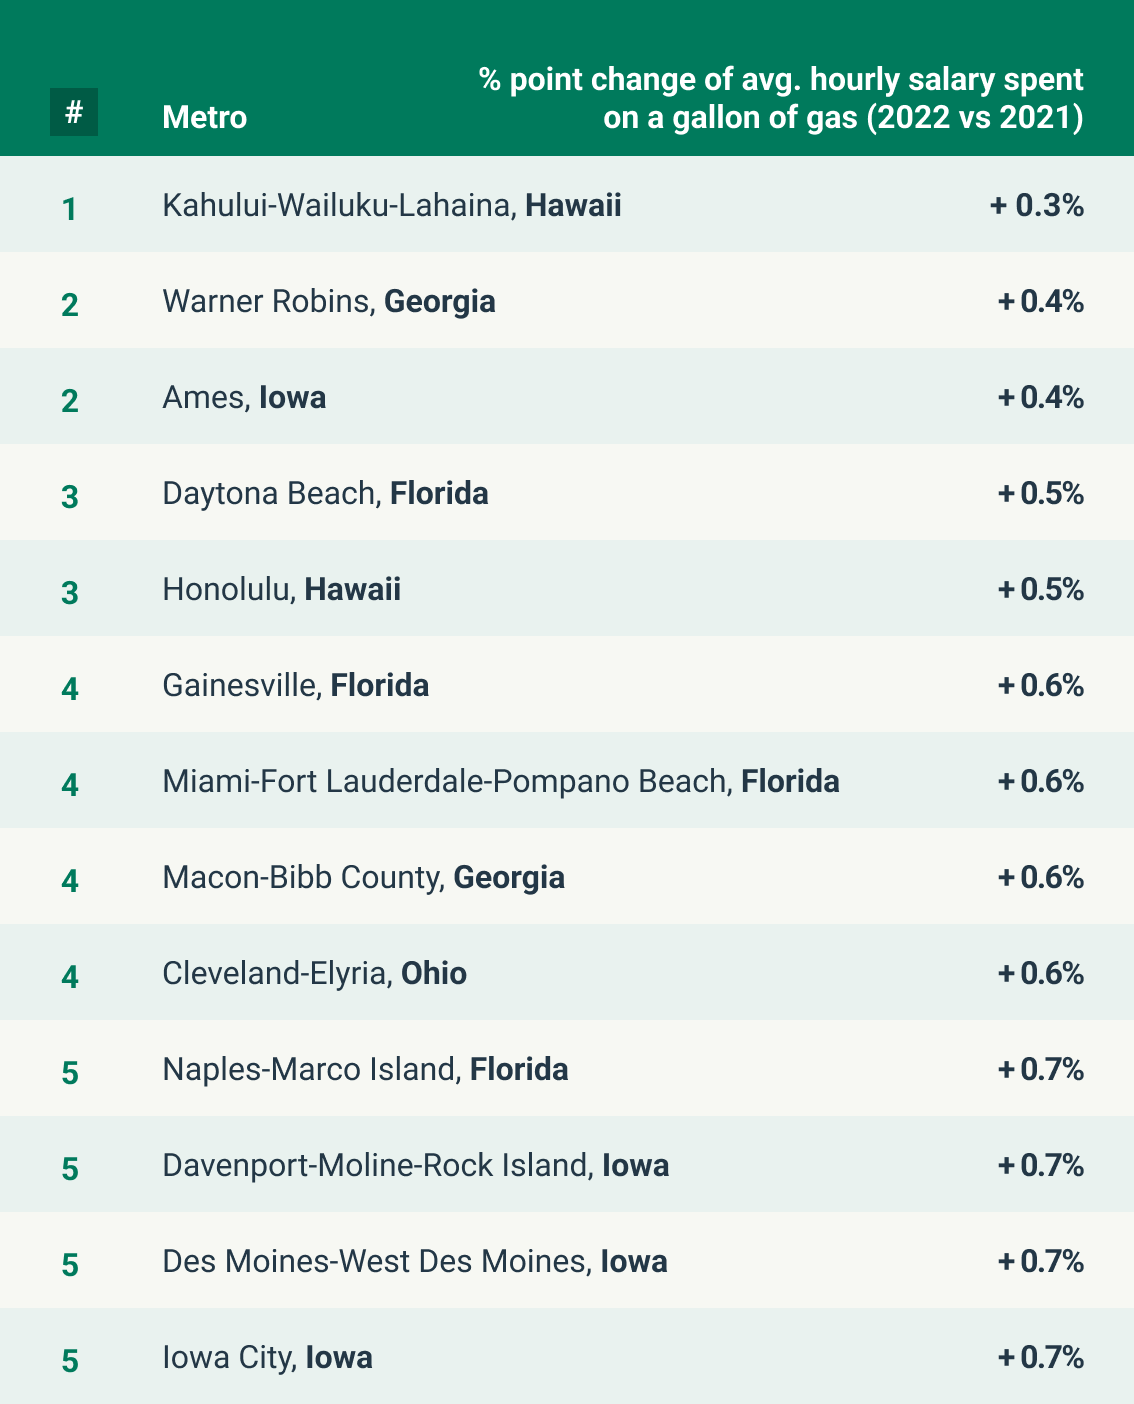
Kahului-Wailuku-Lahaina in Hawaii saw the smallest year-on-year change in gas affordability, with the price of a gallon of gas going up just 0.3% since 2021.
Drivers in Iowa should also be pleased as our study found the state has seen minimal fluctuation in their fuel prices year-on-year - out of the top ten, four were Iowan metro areas with an average increase of 0.6% year-on-year. This included Ames, Davenport-Moline-Rock Island, Des Moines, and Iowa City.
The smallest percentage change in average hourly salary spent on a gallon of gas in U.S. metro areas (2021 vs. 2022)
Based on the smallest percentage point change of average hourly salary spent on a gallon of gas between 2021 and 2022. Sources: HiRoad; GasBuddy local gas prices; BLS.gov local salary data; all data is correct as of November 7th, 2022.
Where in Arizona is gas the most and least affordable?
Throughout 2022, Arizona had been one of the states worst hit by fluctuating gas prices. Although the situation is still evolving, we analyzed which places were the most and least affordable across the Copper State at present.
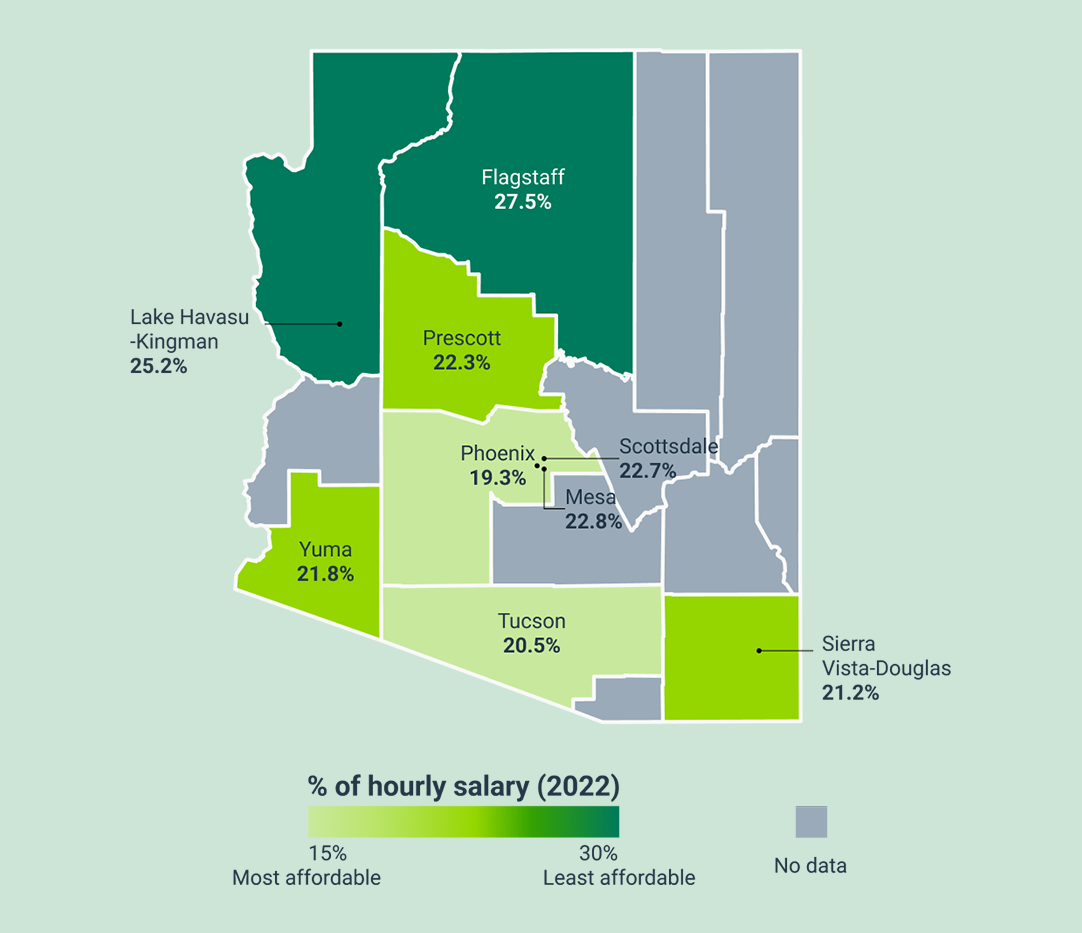
Our analysis showed that the most expensive city was Flagstaff with 27.5% of the average driver’s average hourly wage required to cover a gallon of gas in 2022.
Flagstaff is not as costly as other cities outside of the state however. Hot Springs, Arkansas holds the unfortunate title of the most expensive city for gas in the U.S., with drivers spending 34.9% of their hourly wages on fuel.
Back to Arizona, on the flip side we found that the least expensive location was the city of Phoenix. Here, a car owner can expect to spend 19.3% of their hourly wage on a gallon of gas, although this is still considerably higher than national averages.
Where in Arizona is gas the most and least affordable?
Our analysis includes which places in Arizona are the most and least affordable for gas, based on the percentage of average hourly salary spent on a gallon of gas. Sources: HiRoad; GasBuddy local gas prices; BLS.gov local salary data; all data is correct as of November 7th, 2022.
Where in Arizona saw the biggest and smallest year-on- year change in gas affordability?
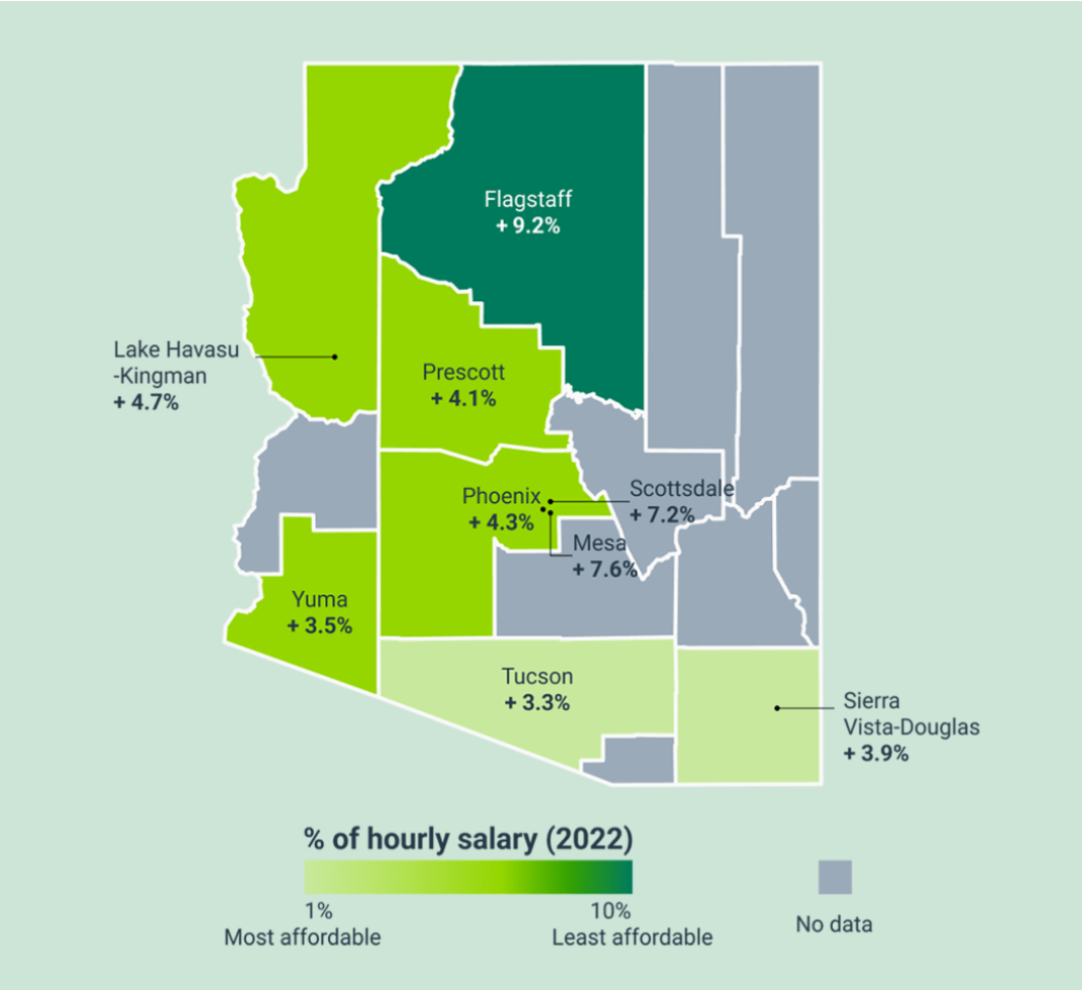
Between 2021 and 2022 Flagstaff was also the city that saw the largest year-on-year growth in gas prices, with an increase of 9.2% to the average person’s hourly salary needed to buy a single gallon. Lake Havasu-Kingman and the City of Phoenix also experienced notable increases, with a year-on-year percentage change of 4.7% and 4.3%, respectively.
The city with the lowest percentage increase relative to local salary was Tucson, experiencing a comparatively smaller uptick of 3.3%.
Where in Arizona saw the biggest and smallest year-on-year change in gas affordability?
Our analysis includes which places in Arizona have seen the biggest and smallest change year-on-year based on percentage point change of average hourly salary spent on a gallon of gas. Sources: HiRoad; GasBuddy local gas prices; BLS.gov local salary data; all data is correct as of November 7th, 2022.
6 Cost Factors to Consider When Purchasing Your Next Car
The affordability of gas is an important factor to take into account when assessing the cost of car ownership, but of course it’s just one of many things to consider. Below we’ve collated a few other key costs drivers should factor in before buying a car in 2023:
1) Sticking to your budgetIt might seem obvious but when looking to purchase a car it’s important to have a realistic budget worked out in advance. The price of a car is arguably the biggest factor as it will determine your base level car ownership costs on both a monthly and annual basis.
While we would all love to drive the latest top-of-the-range car, it’s essential to understand your financial constraints and buy within your means, especially if you’re looking at payment plans.
If you decide to purchase a car on finance, then make sure you understand the financial obligations and monthly payments, and whether you can afford these in addition to other vehicular costs such as fuel and maintenance. After all, the cost of the vehicle itself is only one of the requisite expenditures.
2) Fuel efficiency is key
Fuel efficiency is an important factor as it shows how far your car can travel with a certain amount of fuel, measured by miles per gallon (MPG).
A higher MPG indicates your car is consuming less fuel while you’re driving and is a key measure of fuel efficiency. Having a lower MPG means your car requires more gas to run, which will result in you spending more time and money at the gas station.
Even if your car has a good MPG, fuel efficiency can still be affected by several factors such as style of driving (rapid acceleration etc.), weather, weight, and condition of roads.
3) Don’t overlook the cost of extended warranties
One cost that’s easy to overlook is an extended warranty. If you do encounter any issues with your vehicle, car warranty gives you protection against paying labor costs and replacement of parts (depending on the terms of the warranty).
Extended warranties begin after the manufacturer’s warranty expires or when purchasing a used car. While they’re beneficial, they aren’t cheap, with costs ranging from $1,000 to $5,000.
4) Don’t forget about maintenance
Once you’ve purchased a car, the costs don’t stop there as you’ll need to maintain your vehicle. From servicing to emission inspections, your car will require necessary maintenance to keep it running.
These kinds of costs can be unpredictable and vary from one location to another, so to be safe we recommend putting aside some cash specifically for when maintenance is required.
5) How expensive is the insurance?
To drive a car legally in most states, you need insurance. The cost of insurance can vary depending on the make/model of the car, engine size, age, location and your own driving history.
Your location will also affect your premium, as zip codes in inner cities and more urban areas have a higher cost. They’re considered a greater risk for insurance providers because the more densely populated the area, the more traffic there is.
This increases the chance of having an accident and these areas can often have higher crime rates too.
Despite all of these factors, HiRoad is committed to keeping our auto insurance prices low. Through our innovative app, we'll reward safe driving - saving you up to 50%* a month.
6) Location, location, location
Depending on where you live, car prices can vary. The costs associated with purchasing a car includes demand, needs of the locals, and competition in each state. Car prices are also affected by taxes and registration fees.
As an example, California is
considered one of the most expensive states to own a car in because of sales taxes and fuel prices.*The discount applies to the variable portion of your premium. A fixed expense is added to that to determine your final premium.
Methodology
The methodology for this campaign takes the most up-to-date fuel prices in each state and close to 400 metropolitan areas and compares them against the average hourly salary of Americans in the same locations.
To find out which areas have seen the most fuel price volatility over the course of 2022, we compared the price and overall affordability of gas in each location with data from the previous year.
When conducting our analysis on annual fuel cost, we considered the average U.S. driver driving a certain amount of miles per year, based on the average driving distance in each state, using a typical passenger car with a fuel efficiency of 39.4 miles per gallon.
For the average cost of filling up a full tank of gas, we consider a car to have a fuel tank size of 16 gallons.
All data is accurate as of November 7th, 2022.
